Analyzing particles is essential in a wide range of scientific and industrial fields. Particle characteristics such as size, shape and surface properties can affect the mechanical, optical, thermal and magnetic properties of the material and significantly influence the behavior and functionality of materials. The particle properties can also affect their performance in a range of applications including pharmaceuticals, catalysis and cosmetics. Accurate particle information is essential for manufacturers to meet regulatory standards and improve product performance. In this blog, we delve into two complementary techniques, SEM and DLS, that can be used for a more comprehensive understanding of nanoparticle morphology.
Scanning Electron Microscope (SEM)
SEM is a widely used tool for particle analysis that allows direct visualization of size, shape, and surface features of the particles. It works by directing a beam of electrons across a sample to produce high-resolution images of individual particles. Analysis of SEM images can generate various particle-related statistics such as size, shape and size distributions. SEM in combination with Energy Dispersive X-ray Spectroscopy (EDS) can also provide information about the elemental composition of the particle.
SEM typically requires samples to be dry. Particles can be directly dispersed onto a sample stub or can be drop-cast from solution and be analyzed without undergoing extensive sample preparation that could potentially alter their morphology. In cases of non-conductive samples, coating with a conductive material (e.g., gold or carbon) might be required to prevent charging during electron beam exposure.
Dynamic light scattering (DLS)
DLS is another widely used method for particle analysis. It measures the size distribution of particles in a suspension by observing how the intensity of scattered light fluctuates, which helps calculate the particles’ hydrodynamic diameter (HDD). DLS provides an average particle size and polydispersity index (PDI), which indicates the distribution of particle sizes in the sample. DLS provides the size distribution but not information about particle shape or surface morphology. DLS cannot differentiate between large particles and aggregates of small particles, making the method less reliable for polydisperse samples.
DLS can analyze a wider range of particle sizes than SEM and is particularly useful for applications involving particles in liquids, such as paints, cosmetics, and coatings, as it allows for characterization in their natural state. This makes DLS valuable for studying particles in solution and understanding their behavior in complex biological, environmental, and industrial systems.
Why Use Both DLS and SEM?
A comprehensive characterization of particles can be achieved by using both DLS and SEM. DLS gives statistical size information in a liquid environment, representing the hydrodynamic size distribution of a large number of particles. SEM provides high-resolution images that allow for the direct observation of particle shape, morphology, and surface features. Both, quantitative size distribution data (from DLS) and qualitative structural information (from SEM) can be obtained by combining these 2 technologies. This is particularly useful when working with nanoparticles, colloids, or complex particulate systems where both size and morphology are critical to understanding the material’s properties and behavior.
Commercially available Titanium dioxide (TiO2) nanoparticles were used to demonstrate the complementary nature of DLS and SEM for particle analysis. TiO2 are used in various applications, such as pigments in paints and cosmetics, UV filters in sunscreens, photocatalysts for environmental purification, whitening agents in food, and components in ceramics, electronics, and coatings.
DLS and SEM analysis
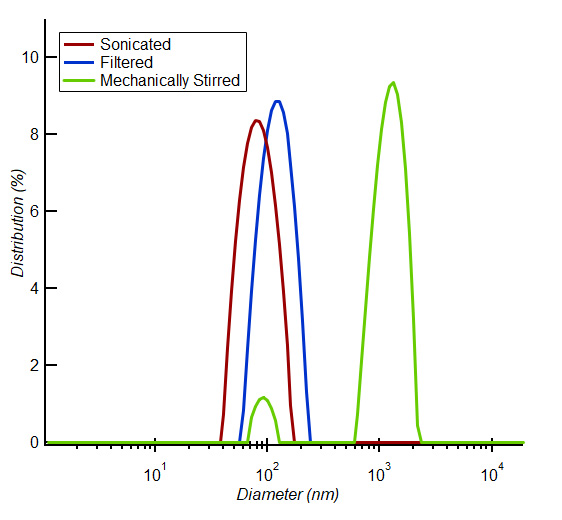
A small amount (~0.01 g) of the TiO2 particles were prepared for DLS analysis by suspending the powder in an aqueous solution of 1% sodium dodecyl sulfate (SDS) and stirring for two hours at 500 rpm. SDS is a surfactant and was used to ensure the titanium dioxide particles stayed in suspension long enough to record accurate results. The hydrodynamic diameter (HDD) of the mechanically stirred solution was calculated to be 1597.2 nm (Figure 1).
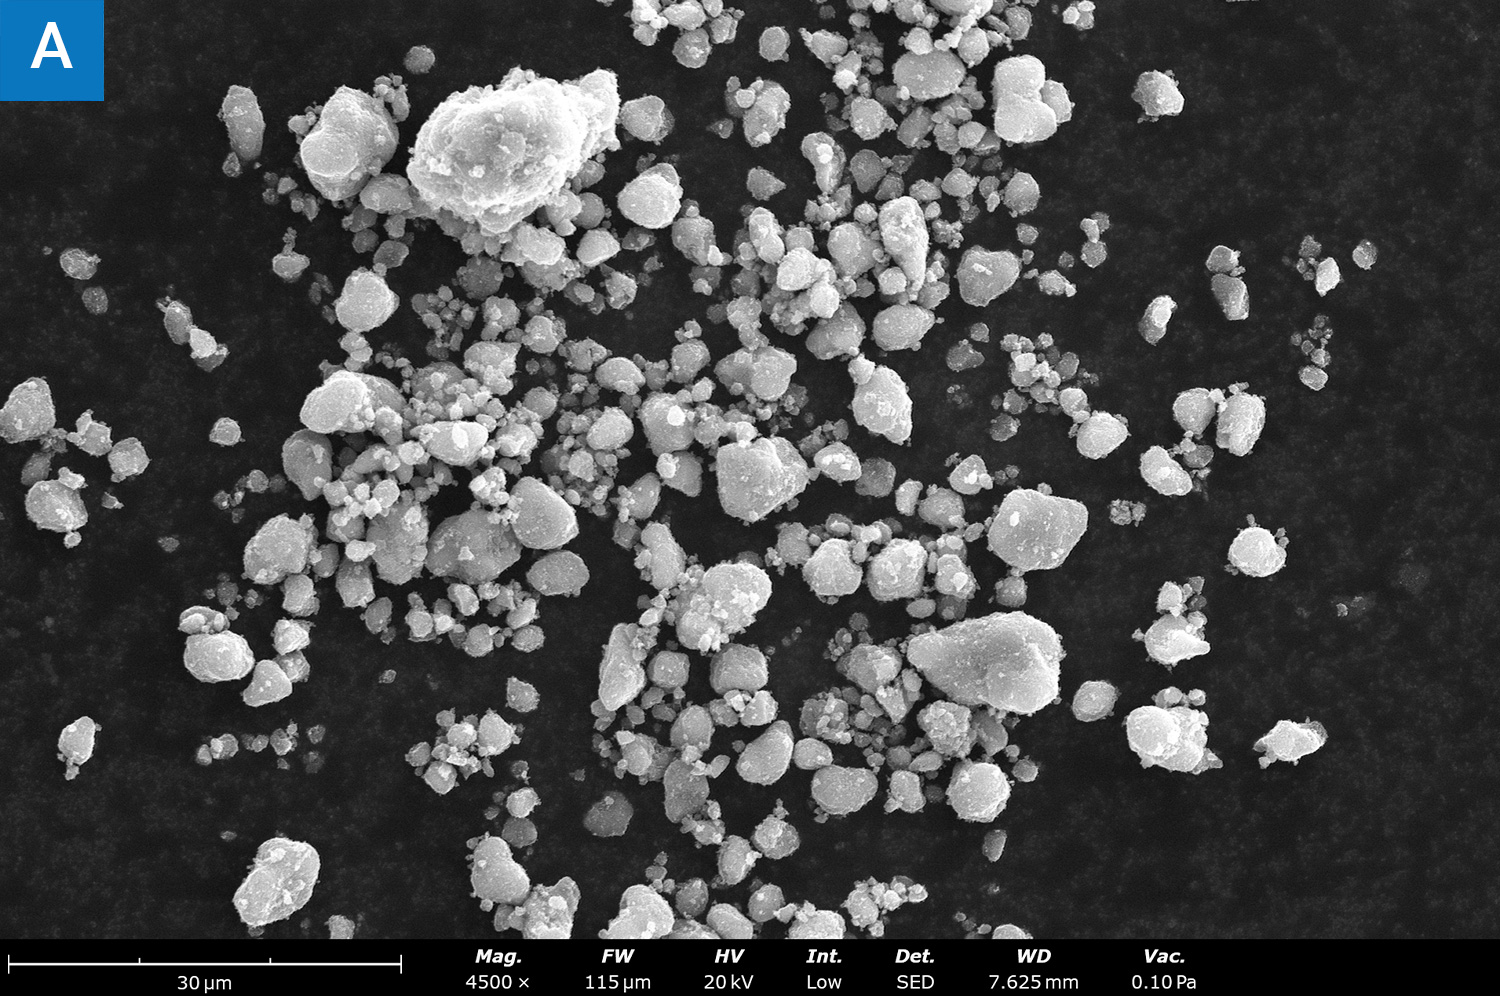
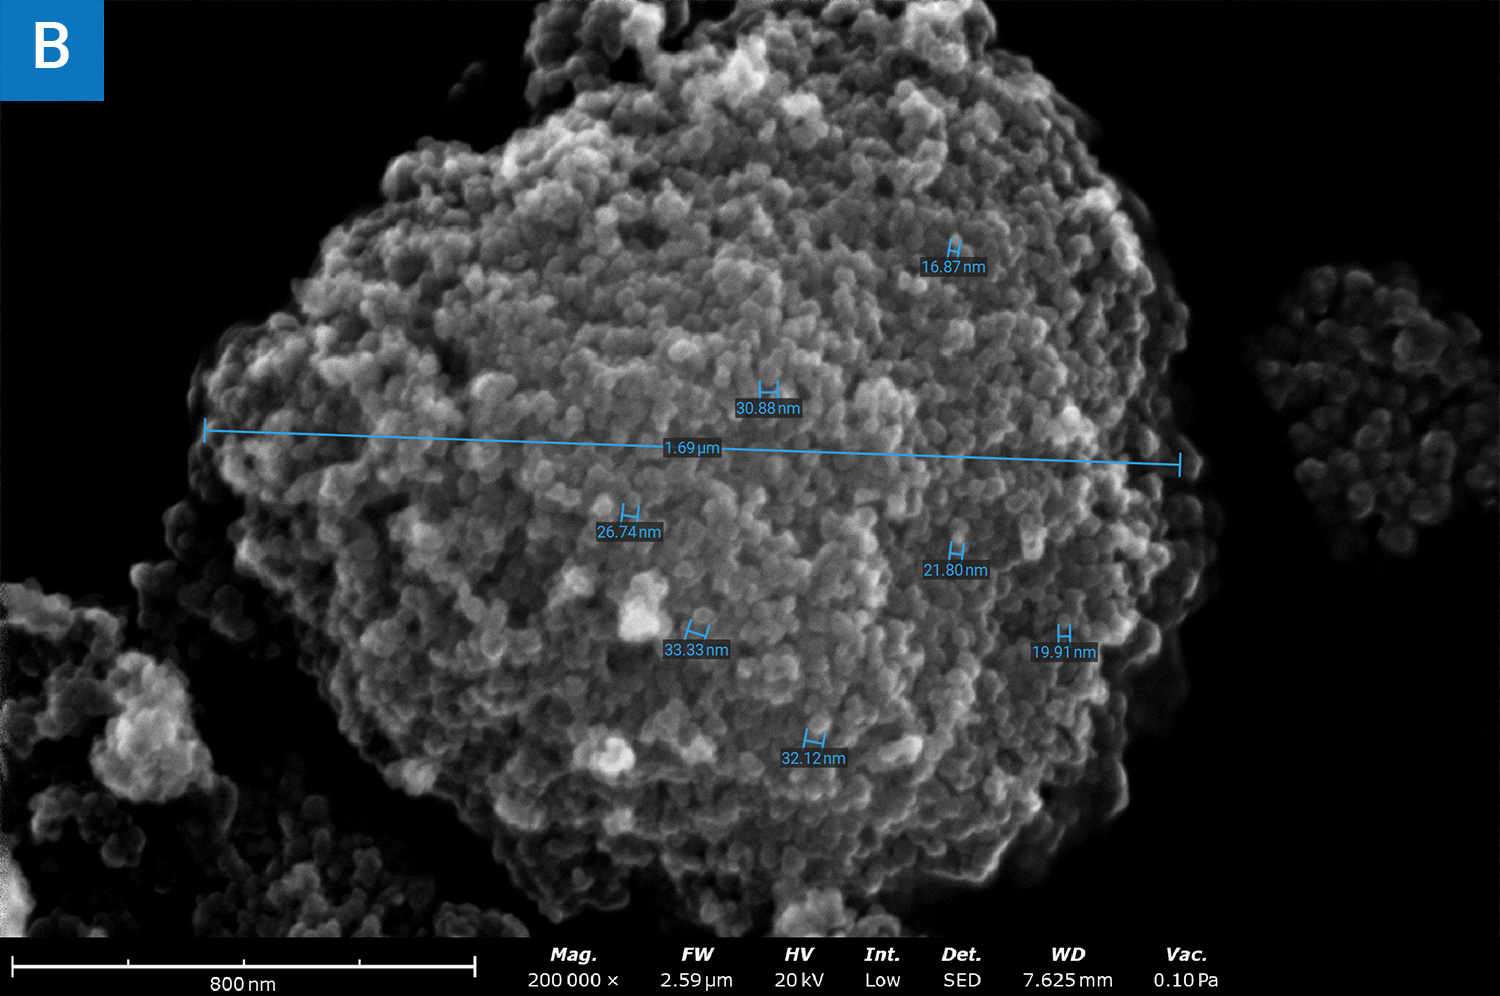
A small amount (~0.01 g) of the TiO2 particles was placed on to a carbon adhesive-coated stub for analysis by SEM. This method of sample loading ensured that the powder remained as close to its original state as possible. The sample was then imaged using a field emission gun SEM (Phenom Pharos) with a secondary electron detector (SED). The SEM images revealed that the TiO2 particles ranged in size of several microns (Figure 2A). The SEM results concurred with the DLS results. Higher magnification images of a 1.6 mm particle revealed that the larger particles were clusters of smaller particles (Figure 2B).
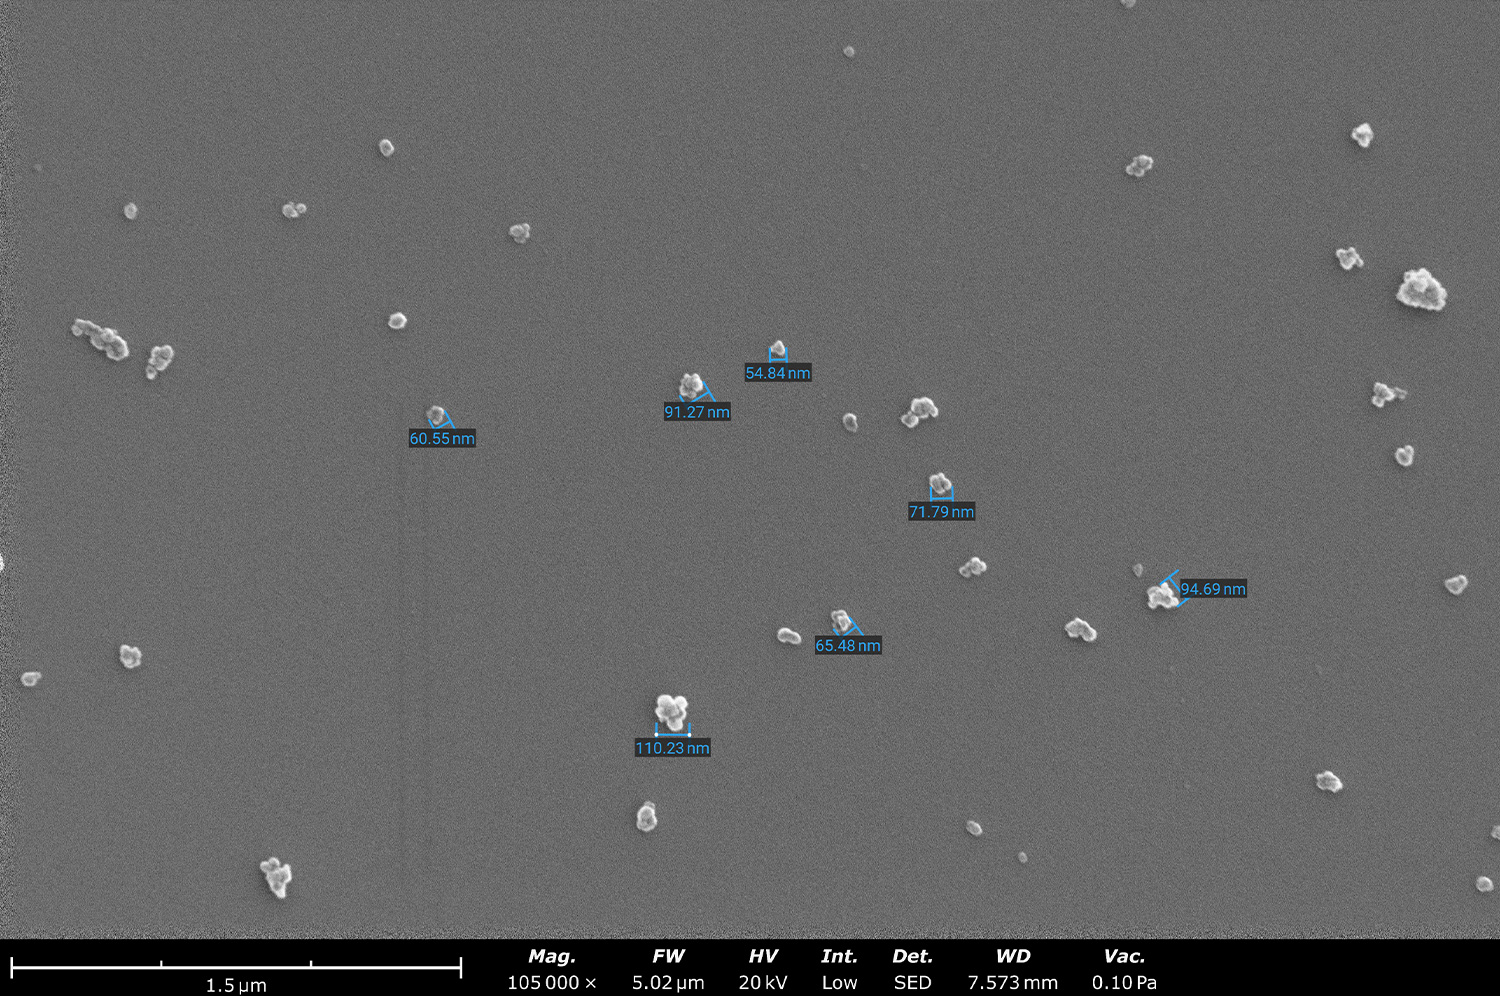
To break up the nanoparticle aggregates, a sample of the TiO2 powder suspension in deionized water and isopropyl alcohol, was sonicated for 1 hour at room temperature. The hydrodynamic diameter of the particles after sonication was found to be 84.14 nm (Figure 1). Sonicated nanoparticle samples in deionized water and isopropyl alcohol were drop-cast onto a precleaned silicon chip. SEM images of this sample smaller clusters, and the particles measured between 50 and 110 nm (Figure 3).
Understanding Particle Aggregation
SEM and DLS analysis of the powder shows that the TiO2 nanoparticles tend to aggregate in clusters of several microns, both in a dry state and in solution. The observed particle aggregations can be attributed to the material properties of TiO2 nanoparticles. When the nanoparticles are in an aqueous solution they exhibit no net surface charge, leading to the increased likelihood of particle aggregation.1,2 Additionally, the large specific surface area of titanium dioxide nanoparticles increases particle aggregation.
When the sample was sonicated to break up the aggregates, the measured particle size was found to be 50-100 nm, which agreed with the DLS data. SEM images clearly showed that these were aggregates of 2–5 smaller particles. SEM imaging added more clarity to the DLS data.
Conclusion:
Analyzing particles is fundamental to controlling and optimizing the performance of materials across various industries. It allows researchers and engineers to tailor the properties of particles to meet specific requirements, ensuring the safety, efficacy, and functionality of products and materials. By combining DLS and SEM, you can gain both quantitative size distribution data (from DLS) and qualitative structural information (from SEM). This is particularly useful when working with nanoparticles, colloids, or complex particulate systems where both size and morphology are critical to understanding the material’s properties and behavior.
References:
- Kignelman, G., et.al (2021). Colloidal Stability and Aggregation Mechanism in Aqueous Suspensions of TiO2 Nanoparticles Prepared by Sol–Gel Synthesis. Langmuir, 37(51), 14846-14855. ↩︎
- Kosmulski, Marek. (2002). The significance of the difference in the point of zero charge between rutile and anatase. Advances in Colloid and Interface Science, 99(3), 255-264. ↩︎